Showing posts with label Trading CPO Futures. Show all posts

Wednesday, October 9, 2019

FCPO Breakout - Potential Move Higher After Tracement

FCPO 30 Minutes Candle Stick Chart
FCPO Dec Contract Gap up at the open this morning indicating the potential bullish momentum ahead.
Suggestion : We could wait for the retracement to enter long position; 50% or 61.8% Fibonacci Retracement will be a good price to long.And of course, the Stop Loss must be place at the most recent low or your choice of the low.
GOOD LUCK!

Friday, October 25, 2013

Potential Correction - CPO

CPO has been up remarkably to the high of 2485. However there are two reasons that CPO might correct in the next few sessions;
1. The price reached the high of 2485 which was also registered in 28 Aug 2013.
2. MACD of hourly chart has been flat despite the surging of the price.

Thursday, October 17, 2013

CPO Daily Potential Correction

CPO has been performing well since the beginning of Oct 2013. However, with the 'hangman' candle stick pattern emerged, there is a high probability for the price to correct or at least a sideways ahead.
Intraday trading has been tough lately. Just look what has happened today, it opened with a beautiful gap up of 2422 then the price plunged all the way to the low of 2369 then closed at 2400. I did not take the long trade due to this reason :) 
' When I See It, I Take It ' should be the trading way for now. No more 'let the profit run' way of trading. 

Sunday, August 11, 2013

Weekly CPO Is Strong

The Daily Chart of CPO broke the low (support) of 2217 registered on 13 Dec 2012. This would make it bearish market ahead if we based on support-resistant technique. HOWEVER, further examine the Weekly Chart, we would realize that CPO could be strong. The MACD of Weekly Chart has been moving upwards creating a divergent between the price and MACD. It means that we have to be very careful on the short side. 
 

Tuesday, July 16, 2013

CPO Daily Potential Rebound

There are two reasons CPO based on daily chart could rebound :
1. The price plunged near the recent low of 2230 
2. Hammer Candle Stick Pattern on today's chart would mean a potential rebound. 

Friday, May 24, 2013

Beanoil Still In Sideways

It looks like bean oil future is still in sideways mode. The long tail candle of Yesterday further confirmed the sideways. We have to wait for a breakout either way to establish a new trend ; ups or downs.

Thursday, April 18, 2013

Bean Oil Daily Chart Updates

It looks like Bean Oil Future is in consolidation, breaking either way would establish a new trend ; ups or downs. Let's watch and see.


Sunday, March 10, 2013

CPO Daily Looks More On Sideways

Looking at the daily chart pattern of CPO, it looks more like a sideways to me.
For microscopic view of say hourly chart, it could go both ways.

Thursday, February 28, 2013

Bean Oil Futures Might Rebound

Bean Oil Futures has been down for more than one week. Looking at the Bean Oil Futures hourly chart, there is high chance for the rebound at least temporary. The MACD has been up despite the price maintained at the low level.
If Bean Oil Futures rebound, CPO would do the same too.

Thursday, December 27, 2012

Missing The Boat Is Worst Than Losing A Trade

I missed the recent rally of CPO Futures (March 2013 Contract) due to my consecutive big loss of the last two trade which affected my judgement.
I feel more miserable of not following my trading system which caused missing the boat than losing a trading. This is the stage I am in right now; "If I were to go in in the middle of noway, I might be late but what if the surge continue." This thinking has been bugging me since 21 Dec 2012 when I lost and missed the long opportunity.
Trading is never easy

Sunday, December 9, 2012

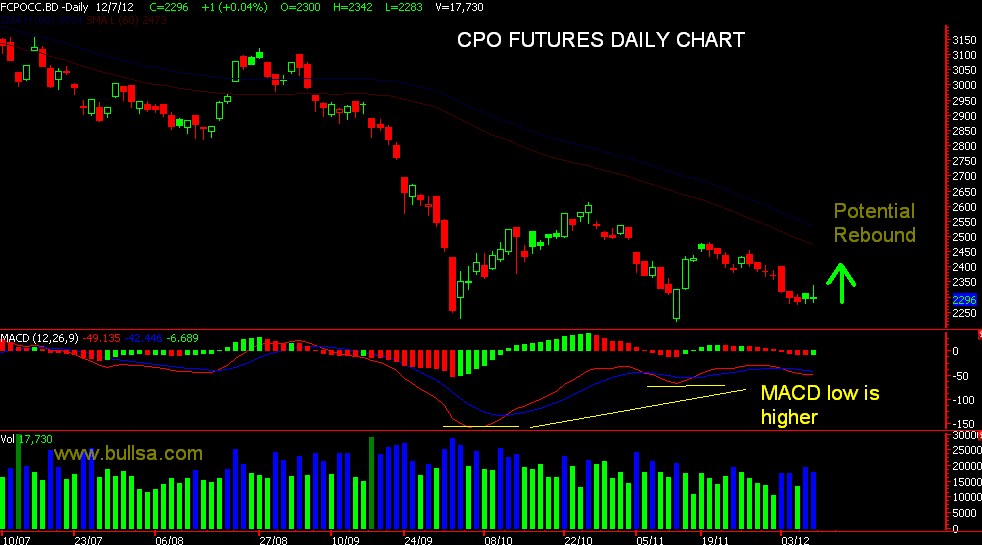
CPO Potential Rebound - Daily Chart

There is a high chance that CPO futures could rebound since the low of MACD is higher which creating a divergent between the price and MACD. Let's see.

Tuesday, November 13, 2012

Bean Oil Futures Could Rebound - Hammer

There is also high chance that Bean Oil Futures could rebound for now; The beautiful black hammer at the bottom of the chart says it all. We shall wait and see.

Monday, November 12, 2012

High Chance CPO Would Rebound


CPO Jan 2013 Future Contract opened at 2228 and closed at 2324; opened gap down low and closed at the high.
With
1. The price hitting the recent support line then rebound and
2. Formed a White Bullish Candle,
there is very high chance that CPO would rebound or at least slow down the speed of the plunge.

Sunday, September 30, 2012

Bean Oil Future Potential Rebound

Bean Oil Futures have been down just like CPO from $58 to $52. With the price hitting the support (refer to the chart) and the formation of hammer followed by bullish harami. There is very high chance Bean Oil futures will rebound.

Monday, September 24, 2012

I Miss The Party

In case you are wondering what I did. I actually did nothing. It was too quick and too furious by the time I wanted to short, it was way below 2650 (112 points down!). Situation like this happen all the time. I rather miss the boat then simply rushing in.
This is trading.

Monday, September 10, 2012

CPO Sideways & BEAN OIL Futures Uptrend

Picture tells a thousand words. All this while, I thought CPO could head upwards as bean oil futures and the rest of the commodities are heading up, even stock markets globally. Comparing the two daily charts ; CPO and Bean Oil futures, we could easily spot out that Bean Oil future is in uptrend and CPO is in sideways.

Friday, August 31, 2012

Bullish Harami = Potential Rebound

CPO Oct 2012 Future Contract closed at 3019 and formed a bullish harami candlestick pattern (based on daily chart) indicating that there is high chance the market would rebound. Do not forget, the daily chart for both CPO and Bean Oil Futures are at the uptrend.

Note : Harami means that the high and the low of the bar are inside the high and the low of the previous candle bar.

Saturday, August 25, 2012

Bean Oil Future Could Rest

Bean Oil Sept 2012 Future Contract closed at $56.28 on Friday (24 Aug 2012). With two dogi emerged for the last 2 days, there is high chance that the market could consolidation.

Thursday, August 23, 2012

Potential Consolidation

CPO Nov 2012 Future Contract closed remarkably at 3078 with 116 points up which was rare. I closed my position thinking that there is high chance CPO futures will consolidation from now given that there were two consolidation early in June and July (please refer to the chart).

Wednesday, August 15, 2012

CPO Daily Chart - Three Tail In A Row

CPO Oct 2012 Future Contract closed at 2858 with the 3rd long tail emerged in the daily chart (refer to chart) indicating that the rebound could be now at least in the next few trading day.