
Showing posts with label CPO Weekly Watch. Show all posts
Showing posts with label CPO Weekly Watch. Show all posts
Monday, October 7, 2013
CPO Weekly Might Be Strong
It is important to see the big picture once in a while. CPO weekly has been descending (the high is getting lower), however, looking at Weekly MACD, it shows otherwise. There is a divergent between the price and MACD indicating that CPO might be Bullish.


Saturday, June 29, 2013
CPO Daily Potential Rebound
There is high chance for CPO (Daily) to rebound given that 1. The price hit 38.2% Fibonacci level 2. The price touched 60 days moving average low.
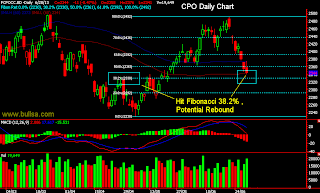


Week to week, the CPO price stays well between the range.

Saturday, June 22, 2013
CPO Daily Potential Correction - Weekly In Sideways
Daily Chart Watch :


It looks like the price of CPO (Aug 2013) is holding well above the up trend line (blue line) and closed at 2438. Technically speaking, the resistant of 2505 is rather strong for now. Unless it can break above the high, CPO still has high chance fro correction.

Weekly Chart Watch :
CPO has been in consolidation for more than 37 weeks. This is quite unusual. The market always does what it pleases. We just have to watch and wait patiently.

Saturday, June 8, 2013
CPO Daily Remains Bullish With Potential Minor Correction

CPO could head higher as it breaks the recent high based on daily chart and of course there will minor correction along the line.

Saturday, May 25, 2013
Daily CPO Near Correction & Weekly Remained Bullish
I started this weekly watch series on CPO to at least get some idea of CPO current situation daily & weekly.
Daily Chart : CPO Daily Correction Near
CPO has been up in May 2013 ; from the lowest point of 2230 registered on 6 May 2013 all the way to the high of 2375 on 24 May 2013 (a 145 points range).
With the price reaching the upper downtrend line and the upper line of 60 moving average, the minor correction is very near. Please refer to the daily chart.


Weekly Chart : MACD Is Making Higher Low
Weekly CPO is still doing fine consider the MACD is still moving up and making higher low.
Daily Chart : CPO Daily Correction Near
CPO has been up in May 2013 ; from the lowest point of 2230 registered on 6 May 2013 all the way to the high of 2375 on 24 May 2013 (a 145 points range).
With the price reaching the upper downtrend line and the upper line of 60 moving average, the minor correction is very near. Please refer to the daily chart.


Weekly Chart : MACD Is Making Higher Low
Weekly CPO is still doing fine consider the MACD is still moving up and making higher low.
Subscribe to:
Posts (Atom)